

Engineering.com’s research into “How Engineers Find Information 2019” is an annual report that we create to help marketing professionals understand how best to target their messaging to engineers. This year’s survey is well underway, with over 1,400 responses to date and a few more days of data collection to go. We’re eager to start analyzing that data and have high hopes that what we find will be of immense value to marketing professionals.
One of the highlights of last year’s report was the discovery that engineers consume a lot of content—8.3 hours per week on average, and even more by senior leadership. These numbers were much higher than we ever expected.
We asked the same question this year, and early results suggest that the number is even larger – 10.5 hours per week, an increase of 27%.
That’s crazy good news for marketers, right? Engineers are spending even more time consuming information that we can create or influence. In this post, let’s take a sneak peek at the data to see what else we can learn.
We will reveal all in a webinar for technology marketers on December 6th, so be sure to join us.
Content Consumption is Up Across All Platforms!
The first thing we looked at is where content consumption was occurring compared to last year. We did this by asking about the number of hours each week spent consuming on a computer, smartphone, tablet or a good old-fashioned printed trade publication. We were expecting to find that the growth would be isolated to one or two platforms, but surprisingly, consumption is up across all platforms as per the table below:
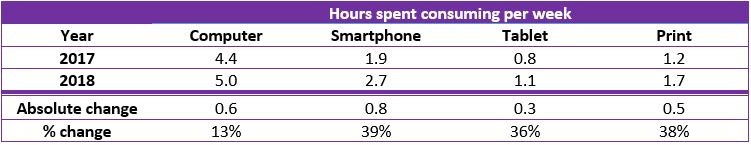
This is a stellar result for marketers, as you’ll have even more opportunities to connect with your prospects. 84% of consumption is occurring digitally, allowing you to employ tactics like search engine optimization, PPC advertising and content marketing to connect with your desired prospects.
Another interesting finding here is that the growth in mobile consumption is equal to that of computer and print consumption—1.1 hours for both. In absolute terms, this means—and I know we’ve been saying this for years—that you really need to ensure your site is optimized for mobile.
What’s spurring this growth? Are engineering professionals just spending more time consuming across all platforms, or are some devices being used more? Let’s look at that next.
Is it Diversity in Consumption or Depth of Consumption That’s Up?
While the numbers in the table above showed the average for any engineering professional in the study, not everyone uses every platform. Some choose only to consume content on their computer, while others regularly use all four platforms. To better understand what we’re seeing, lets look at penetration by platform across the two years:
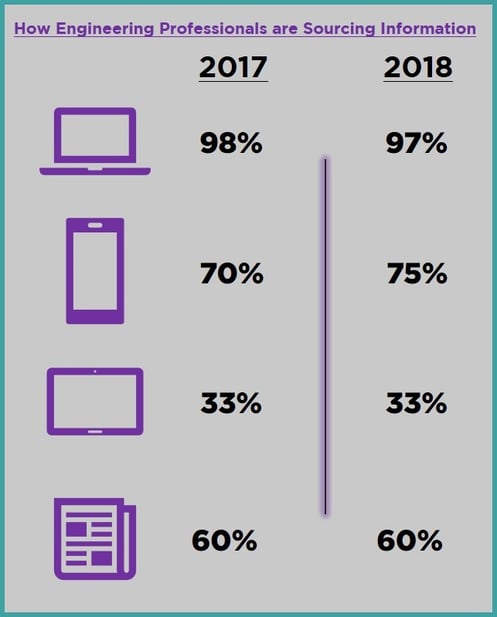
With numbers that tight, you’d think this was a longitudinal study using the same people each year (it isn’t). Computers, tablets and print publications are flat. Only smartphone usage made any kind of considerable gain over last year.
However, this is also good news for marketers. It means the gains we’re seeing show that engineers are going deeper on content, through the same channels they have shown a preference for in the past, potentially spending more time with content that you’ve produced.
So What Kind of Content Should You be Producing?
We asked respondents of the survey to reflect on their engineering content consumption over the last year and estimate the frequency with which they accessed a variety of information sources. In total, we asked about 12 common content sources, from podcasts to live events. In our upcoming webinar and in the full report we’ll dive into all 12 sources, but today we’re going to look at just three: short written articles, long-form written articles and video.
Respondents told us whether they were a daily user, weekly user, monthly user, quarterly user, annual user or non-user. From these categories we defined the following groups:
- Fans – daily or weekly users
- Users – monthly, quarterly, or annual users
- Non-users – those who just don’t access this type of content
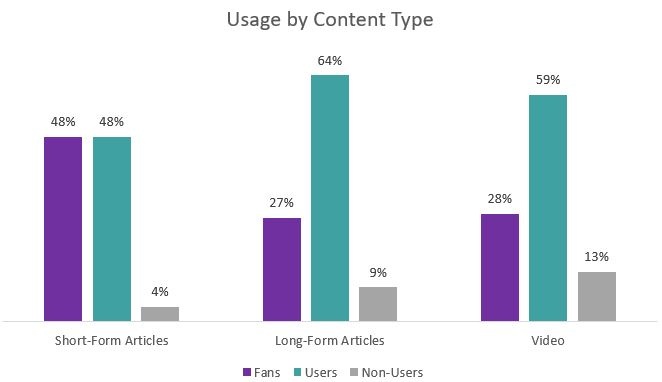
So what kind of content should you be producing? Well, with numbers like these, the answer is all three. That 87% of engineering professionals are getting at least some of their work content through video is still a little bit mind-blowing to me, and something I think is totally awesome!
There is a lot more to unpack here, but we’ll leave the heaving lifting for the webinar, speaking of which…
Next Steps & Learning More
Like I said at the beginning, these are just some preliminary findings, and there is a whole lot more we’re going to cover in the webinar and full research report. We’ve got an incredibly rich data set covering a bunch of hot topic issues in engineering marketing today, such as chatbots and ABM. We’ll also have a whole lot more on the content consumption patterns and preferences of engineering professionals that you’ll be able to operationalize to help get you out of the gate quickly in 2019.
Want to make sure you don’t miss out? Sign up for the webinar on December 6th.
Thanks for reading, until next time!
-Andrew


